Reputation Risk Is Dead — I Went Looking For The Body
Type the email address you have had the longest into Have I Been Pwned. You will get back a list. Not a warning, not a shock — a list, the way a bank statement is a list. That shrug is what this post is about.
Every threat model I have reviewed in the last decade has a row called reputational damage. It is almost always scored High. It is almost never explained.
I set out to argue that it measures nothing — that the public got tired, and we should stop pretending otherwise. I was two-thirds right, which is the worst score available.
The chain that has to hold
Reputational consequence is not one event. It is a chain, and chains can be tested link by link. For a breach to cost you anything through your customers, four things must happen in order: the public has to find out, blame you, be able to act usefully, and keep acting.
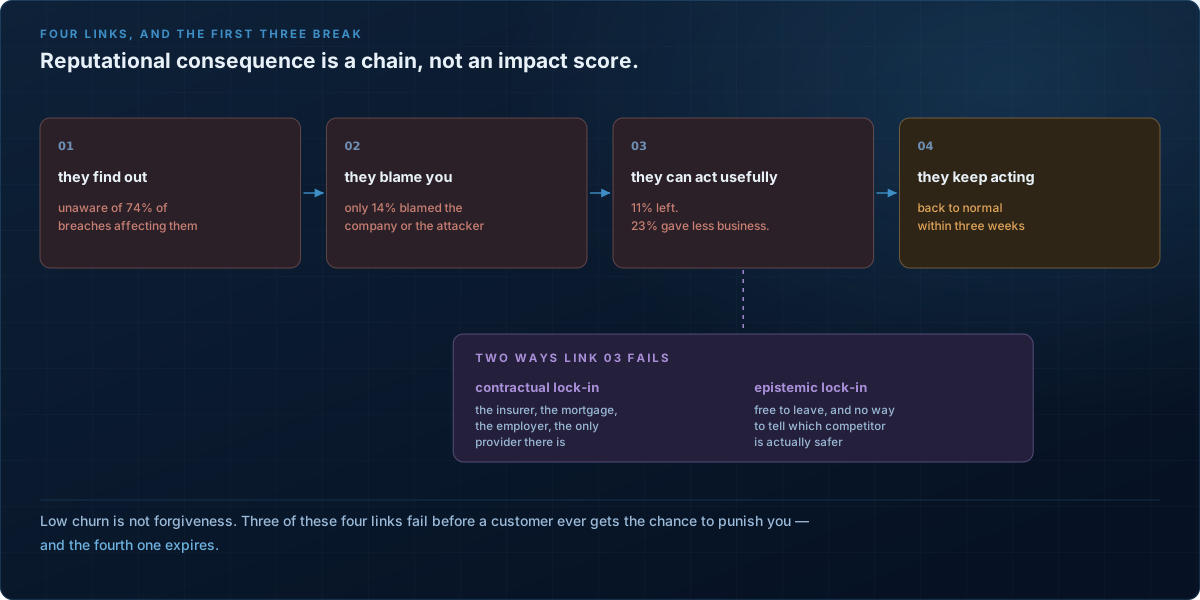
Link one fails immediately. Shown the real breaches that had exposed their own email addresses, people were unaware of 74% of them. The signal does not arrive.
Link two fails more strangely. Of those who did learn, only 14% blamed the company or the attacker. The rest blamed themselves — for reusing an address, for signing up to too many sites. You cannot be punished by people who think it was their own fault.
Link three is the one everybody gets backwards. The circulating number is that 11% of notified consumers stopped dealing with the company — quoted as proof nobody cares.
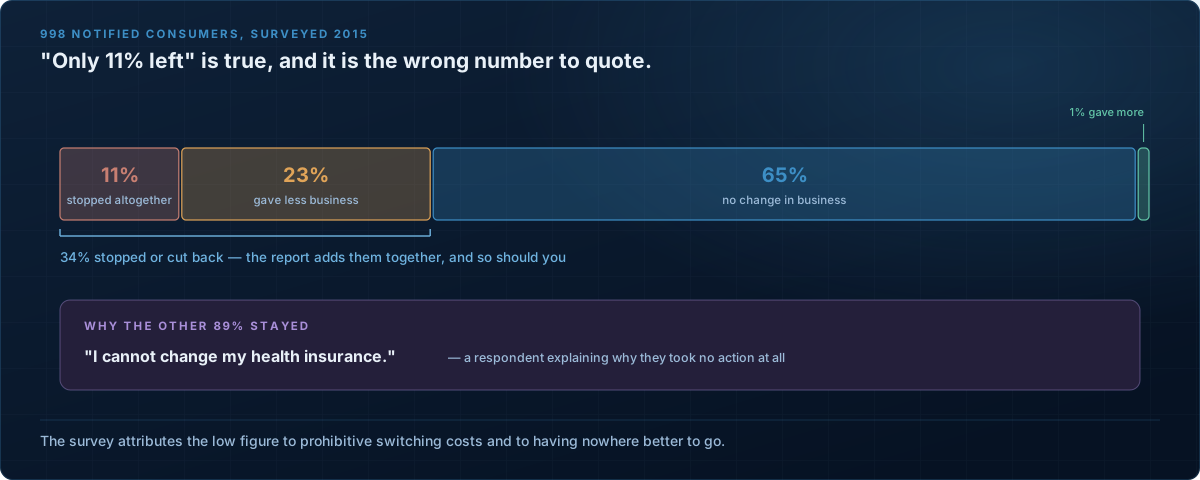
A further 23% gave the company less business. RAND adds them — 34% stopped or cut back — so the circulating figure understates the commercial effect threefold. And RAND attributes that low departure rate not to goodwill but to switching costs: “the switching costs incurred from changing health insurers, mortgage companies, or employers may be prohibitive,” and often there is no alternative at all. One respondent who took no action: “I cannot change my health insurance.”
Low churn does not measure how forgiving your customers are. It measures how trapped they are.
But that only explains the insurers
The obvious objection nearly broke this argument: it is trivial to switch food delivery apps. Why does nobody leave those?
Because leaving requires information that does not exist. RAND notes, in the same passage, a “lack of comparative data to assess whether competitors are doing a better job.” Ross Anderson gave the structural reason twenty-five years ago, applying Akerlof’s market for lemons to security: when “buyers don’t have as much information about the quality of the products as sellers do, there will be severe downward pressure on both price and quality.”
Security quality is invisible at the point of choice. You can cancel a food delivery app in four taps and still not name a safer one. Call it epistemic lock-in: free to leave, no basis on which to choose. It applies to every market, not only the sticky ones.
And where an intention forms, it evaporates. Asked later whether they had acted, people had not — they were “apathetic about breaches, considered potential costs, forgot, or felt resigned.”
Forgot. The most honest word in this post.
The part where I was wrong
If the chain is that broken, the cost should be near zero. Two findings stopped me.
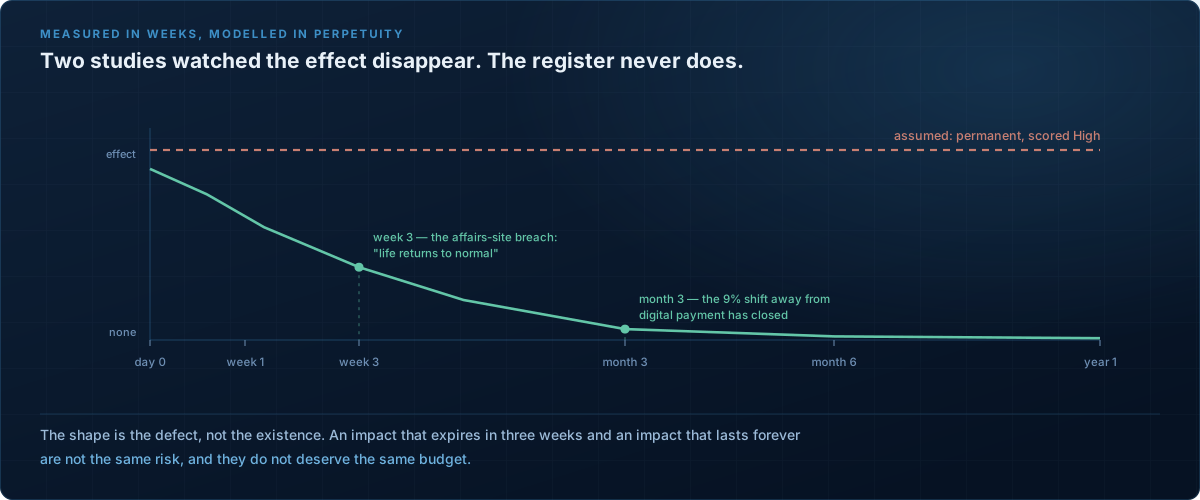
The effect is real — it expires. After breaches at a food delivery platform, a bank and an online grocer, digital payments fell 9% against cash; three months later the gap had closed. And in the breach of a site for arranging extramarital affairs — about the most radioactive data there is — by the third week, “life returns to normal.”
The market punishment is real — it is hidden. Markets look unresponsive because firms time the announcement for busy news days. On days with more predictable news pressure, 4.44% more breaches get announced, and the practice is commoner for severe breaches and for leaked health data and credentials. Control for it and the punishment appears: a median $347 million decline in market capitalisation, falling to $85 million when released into the noise.
Investors did not stop caring. Companies got good at picking the day.
I expected the cost to have moved. It hasn’t.
My theory was that consumers stopped punishing breaches but someone else started — insurers, regulators, procurement. I went looking and mostly did not find it.
Insurance says no. Cyber rates are down 4%, the twelfth consecutive quarterly decline. That is not a market pricing in rising consequence.
Regulators say flat. Aggregate GDPR fines stand at €7.1bn since 2018, but 2025 came in at €1.2bn, broadly matching the year before — while notifications broke a long plateau to rise 22%, to 443 a day. More reportable events, the same money.
Procurement I cannot support. Every statistic I found about security questionnaires killing deals came from a company selling questionnaire automation. So I will say only what I have seen: a recent incident turns a vendor security review into a quarter of delay. First-hand experience, not evidence.
I would still bet the cost moved into controls demanded at renewal rather than price. I could not source it, so it stays a bet.
Where does that row even come from?
Here I have to correct myself again. I assumed the culprit was our risk-quantification standards. I went looking for where “reputational damage: High” is actually defined, and in threat modelling it largely is not.
STRIDE classifies threats — spoofing, tampering, repudiation, information disclosure, denial of service, elevation of privilege. It describes how a threat does its damage, not what the damage is worth. DREAD, the scoring scheme beside it, rates damage potential on a ladder from “no damage has been caused to the organization” to “the entire information system has been destroyed.” Every rung is a technical state; none is a business consequence. Automotive TARA, under ISO/SAE 21434, assesses damage against safety, financial, operational and privacy. You may add categories with justification, but reputation is not among the four it names.
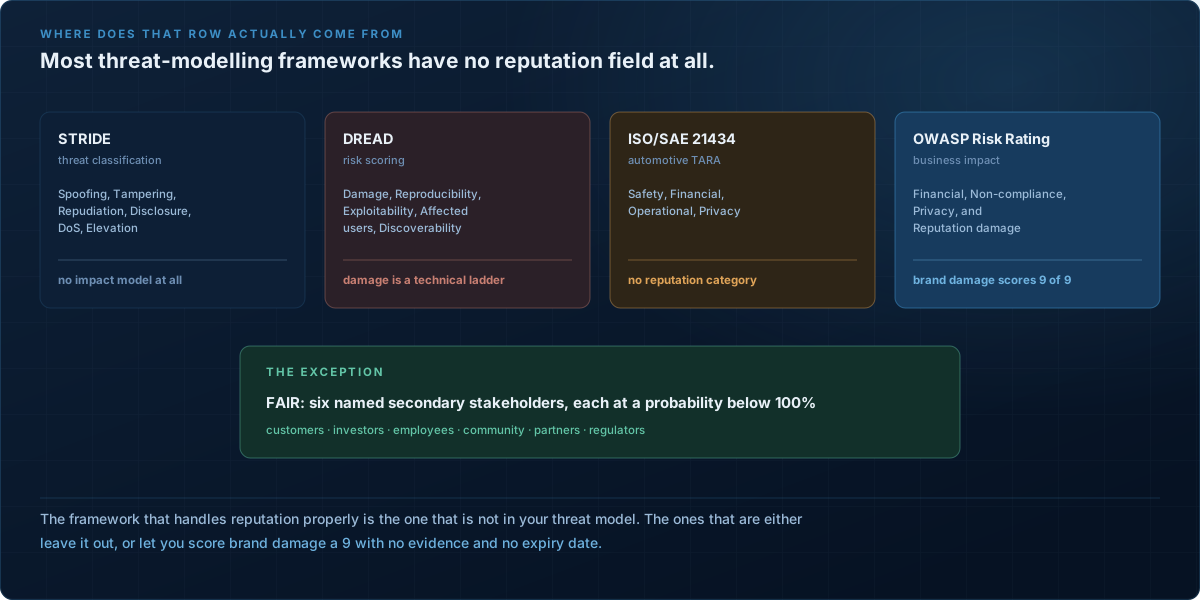
The one place it is formalised is the OWASP Risk Rating Methodology, where reputation damage is a business impact factor on a four-rung ladder: “Minimal damage (1), Loss of major accounts (4), loss of goodwill (5), brand damage (9).”
Nine out of nine for “brand damage”, with no named stakeholder, no evidence requirement and no expiry date — then averaged with three other factors into a single impact score.
Meanwhile the framework that handles reputation properly is the one not in your threat model. FAIR has no reputation field either; it has Secondary Loss, attributed to six named stakeholders — customers, investors, employees, the community, business partners, regulators — each occurring with probability “less than 100% because they are indirect.”
So the defect is not that we score reputation too high. It is that the artefacts where the number lives have nowhere to put it, and six stakeholders with six decay rates collapse into one adjective. My read on why nobody has fixed it: it is the only row no single function owns — marketing does not, security does not, finance will not price it — so it becomes where uncertainty goes to die. A hypothesis, not a finding.
The fix is unglamorous. Score the stakeholder you can name, give the loss a decay horizon in weeks, and if you cannot say how you would observe it, score it zero and write down why.
The other half: can anyone be clean?
If vulnerability disclosure is exploding, is it reasonable to hold anyone to a standard of being vulnerability-free? The explosion is real, and bigger than I assumed.
Publication ran at 26,431 in 2022 and 49,972 in 2025 — then 77,584 in the first nine months of 2026. FIRST revised its own forecast up 46% mid-year, naming AI-assisted discovery among the drivers.
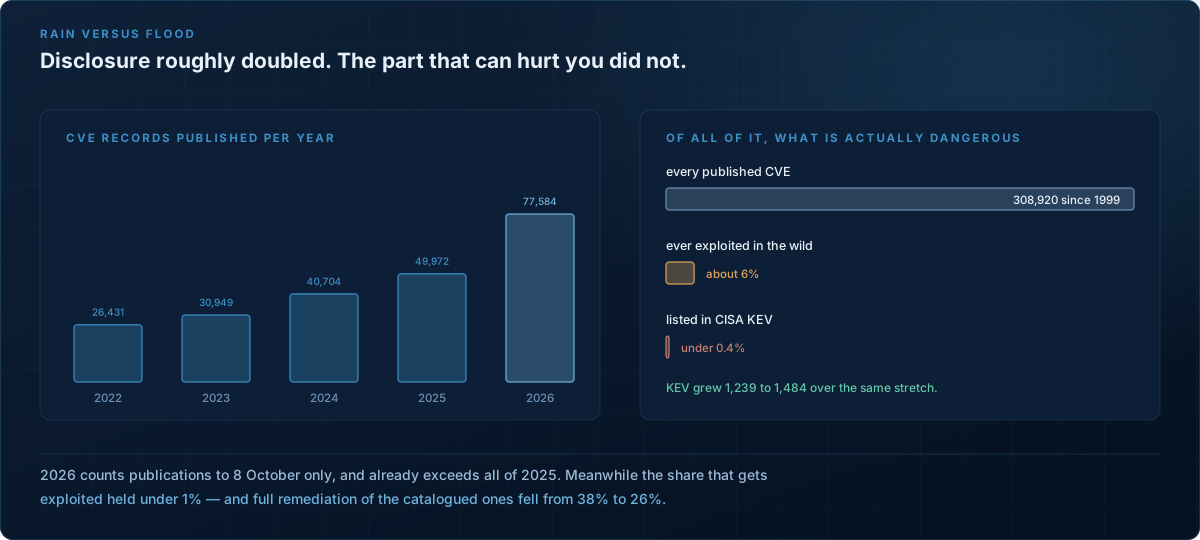
Then FIRST undercuts the panic in its own forecast:
Actionable exploitability remains flat: when filtered for real-world risk (CISA KEV entries or EPSS scores above 10%) the patching burden has not materially increased, despite the surge in raw volume.
They call it the difference between rain and flood. Only about 6% of published vulnerabilities have ever been seen exploited at all.
The 6% is not a safety margin
The obvious objection is the right one: that leaves 94% nobody has weaponised yet. If the cost of writing an exploit collapses, does the gap close?
Partly — and there is a number here that should bother you. Given the CVE description, a GPT-4 agent in 91 lines of code exploited 87% of real one-day vulnerabilities in a research benchmark. Without the description, the same agent managed 7%. The write-up is the enabling artefact.
But the 6% never measured how hard exploits are to write. It measures attacker economics — what is reachable, deployed, and worth the trouble. The Linux kernel carries thousands of catalogued CVEs at an exploitation rate near zero, because those code paths are unreachable in most deployments.
So, as an expectation rather than a finding: the exploited share rises and does not approach 100%. Automation collapses one input to the attacker’s calculation and leaves reachability and payoff untouched. Watch the exploited fraction, not the CVE count — which is what EPSS exists to tell you.
I also have to correct something I believed going in. I assumed the danger was new, 0-days arriving daily. It is not: nearly half the entries in the known-exploited catalogue show persistent exploitation, and only 20% of those are recent. Attackers are winning with old, catalogued bugs.
Which makes the rest worse. Exploitation is now the most common way breaches start, at 31%, and organisations got worse at the 6% that matters: 26% of known-exploited vulnerabilities fully remediated, down from 38%, at a median of 43 days, up from 32. Verizon’s own summary:
By day 7 … somewhere between 60% and 70% of KEV vulnerabilities remain open regardless of year, volume or organizational maturity. This first-week rate barely moved despite three years of additional process development, tooling investment and mandate pressure.
They float it as a possible “speed of light” for remediation, and conclude that “choosing the correct ones to patch really is the key strategy.”
So nobody can be vulnerability-free, and the ceiling has now been roughly measured. The haystack doubled, the needles did not, and the people holding magnets got slower — a prioritisation crisis wearing a vulnerability-count costume, and the sensors argument arriving with numbers attached.
Where this costs you
This post is one step from “breaches do not matter, deprioritise them,” and that conclusion is wrong. Four limits, all imposed by the research itself.
Switching costs cut both ways. Where leaving is easy and quality is visible, you get the churn health insurers are spared.
Transience is conditional on response. The fast decay was measured at companies that answered the phone. None of this licenses silence.
A flat average is not a flat tail. Of that €7.1bn in fines, €4.04bn landed on one regulator’s docket.
Survivorship is baked in. Each of these studies measures a business that continued to exist.
Where I would not run this argument at all: a regulated sector, a consumer-trust business, or anywhere one incident is existential rather than expensive. If a single breach can kill your company, score reputation High and stop reading.
So what do you actually do?
If the public barely notices and the regulator barely charges, the temptation is to let it go. That is backwards: an incident is the only moment your security posture becomes legible to anyone outside the team.
Breaches draw a line between the companies that care about security and the companies that claim to. The test is not whether you were breached — eventually everyone is. It is what you do after: whether you disclose before you are forced to, whether you change the baseline you were running on, and whether the mechanism survives the news cycle.
That last part turns the decay curve from an excuse into an instruction. Three weeks is not only how long the punishment lasts — it is how long anyone is looking. Any response built for the audience is wasted, because the audience leaves before the campaign lands. What outlives the window is the control you keep running once nobody is watching.
The disclosure trick also has a price the market data hides. Firms that delay announcement lose more trust than those disclosing immediately — and even after remediation, late disclosers end up with lower repaired trust than prompt ones. Burying the news in a busy day protects your share price and permanently caps how much trust you can rebuild.
So who are you showing? Not consumers — they will have forgotten, and could not evaluate it anyway. The parties with institutional memory keep files: regulators, enterprise customers, auditors, insurers. They are also the only audience that reads evidence rather than statements. Publish the mechanism, not the apology.
So is it dead?
No. It is smaller than you think, it expires faster than you model, and it is routinely hidden by the people who owe it.
Your customers did not forgive you. Most never heard. Half of those who did blamed themselves. And the rest could not have left if they had wanted to — not because you locked the door, but because nobody has ever been able to tell them which door leads somewhere safer.
That is not a reputation risk. That is a market failure you happen to be benefiting from — and it is worth remembering which of the two tends to get regulated.
Which leaves a choice nobody will audit. The breach will not cost you what the register says. Fixing what it exposed still costs exactly what it costs. The companies that pay it anyway are the ones that meant it.
Sources
- Consumer Attitudes Toward Data Breach Notifications — RAND, 2016. The churn split and the switching-cost explanation for it. Fielded 2015.
- “Now I’m a bit angry” — USENIX Security 2021. The 74% and 14%. Its extended version, Awareness, Intention, (In)Action (ACM TOCHI, 2023), adds the follow-up on whether people act on their intentions — read that one if you read one.
- Transient Customer Response to Data Breaches — Management Science, 2024. The decay, on real payment data. Indian consumers only.
- When the Data Are Out — Marketing Science, 2024. The three-week result. One breach.
- Data Breach Announcements and Stock Market Reactions — Management Science, 2022. Disclosure timing and the $347M figure. US-listed firms.
- OWASP Risk Rating Methodology — the one place reputation damage gets an explicit score.
- Microsoft DREAD Threat Classification — the damage-potential ladder quoted above.
- Security Risk Analysis Methodologies for Automotive Systems — arXiv, 2023. ISO/SAE 21434’s TARA and its four impact categories.
- FAIR Standard v3.0 — FAIR Institute, 2025. Secondary Loss and the six stakeholders.
- LLM Agents can Autonomously Exploit One-day Vulnerabilities — arXiv, 2024. The 87%/7% figures. Fifteen vulnerabilities, one model: the most load-bearing small study here.
- It pays to be forthcoming — Internet Research, 2023. Late disclosure lowers repaired trust even after remediation. A survey experiment, so weaker than the behavioural work.
- 2026 Data Breach Investigations Report — Verizon. Remediation rates and the day-7 ceiling. Convenience-sampled, as it says itself.
- Mid-Year Vulnerability Forecast — FIRST, 2026. The projection and “actionable exploitability remains flat”.
- A Visual Exploration of Exploitation in the Wild — Cyentia with FIRST. The ~6%.
- Why Information Security is Hard — Ross Anderson, ACSAC 2001. Why you cannot shop on security.
- Global Insurance Market Index, Q2 2026 — Marsh. Cyber pricing; a broker’s own index.
- GDPR Fines and Data Breach Survey — DLA Piper, 2026. Fine totals and notification rates; the firm admits it cannot explain the spike.
- Volume Is Not Risk — Trend Micro, 2026. Vendor research; used only for KEV growth.
Everything numeric above is sourced and linked, and the detail sits in those sources rather than here. The 2026 CVE counts are my own query against the NVD API on 8 October 2026. What is mine: the four-link chain as a framing device, the term “epistemic lock-in”, the argument that low churn measures market structure rather than goodwill, the read that reputation collapses into one row because no function owns it, and the expectation that the exploited share rises without approaching 100%. The procurement delay is first-hand experience — evidence of a weaker kind. Where I have failed to keep the two apart, the sources are above.